| PEAK PERFORMANCE HOME | PRESENTER HOME | INTERACTIVE PRESENTER EVENT SERVICES | SALES & SUPPORT | SYSTEM BACKGROUND | CONTACT |
 |
Questions - the Key Ingredient for Presentation Success |
 |
| Just for a moment, consider how you’d normally expect to gain attention during an everyday conversation?
What’s the natural thing to do when you want to engage someone’s interest and get them to focus on particular issues? How can you find out what’s really important to others? |
||
 |
The answer is as simple as "ASKING THE RIGHT QUESTION" Being able to ask the right questions and get feedback from the whole audience is the success ingredient of the Interactive Presenter. Ask the right question and you will find your presentation hits the spot. Indeed, asking any question of your audience will result in their participation and a feeling of involvement. With the Interactive Presenter and the right set of questions, a speaker can stimulate the minds of every member of his audience. |
|
Harness Question Power
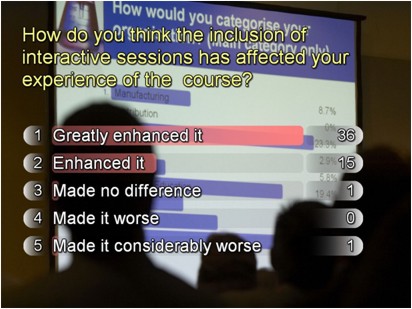
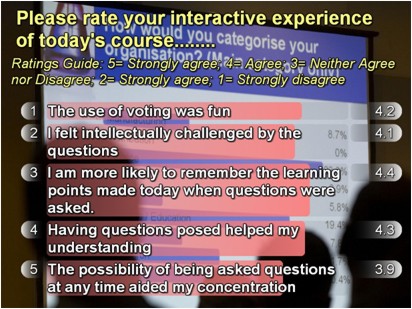
Evidence of the value of questions In February 2009, at the end of a very full day's course of lectures of lectures that included both interactive and conventional delivery sessions, we asked the fifty odd British clinicians who attended to rate the experience of being on the receiving end of interactive presentations. The two voting screens that resulted are shown below. The first screen shows the total numbers voting for each option. The second screen shows the mean average delegate rating on a 1-5 scale..
|
| BASICS | VOTING DATA | CONSENSUS | ENERGY & FUN | 3D MULTIMEDIA SYSTEM | POWERPOINT ADD-IN | WHEN THE SYSTEM SCORES |


